ABCD Pattern Trading
If you’ve ever looked at a chart and felt like the moves were random, you’re not alone. But there’s a pattern many experienced traders use to bring structure to that chaos. It’s called the ABCD pattern, and it’s one of the cleanest setups in trading.
This pattern shows you how price tends to move in measured legs. You’ll see a push, a pullback, and then a second push to complete the move. If you’ve traded long enough, you’ve seen it—even if you didn’t know the name.
At BluSky, many traders use the ABCD trading pattern in their evaluations and funded accounts. It works in futures, forex, stocks, and even crypto. It’s a solid way to plan your trades instead of chasing price.
Let’s break it down so you can start spotting it and using it yourself.
What Is the ABCD Pattern?
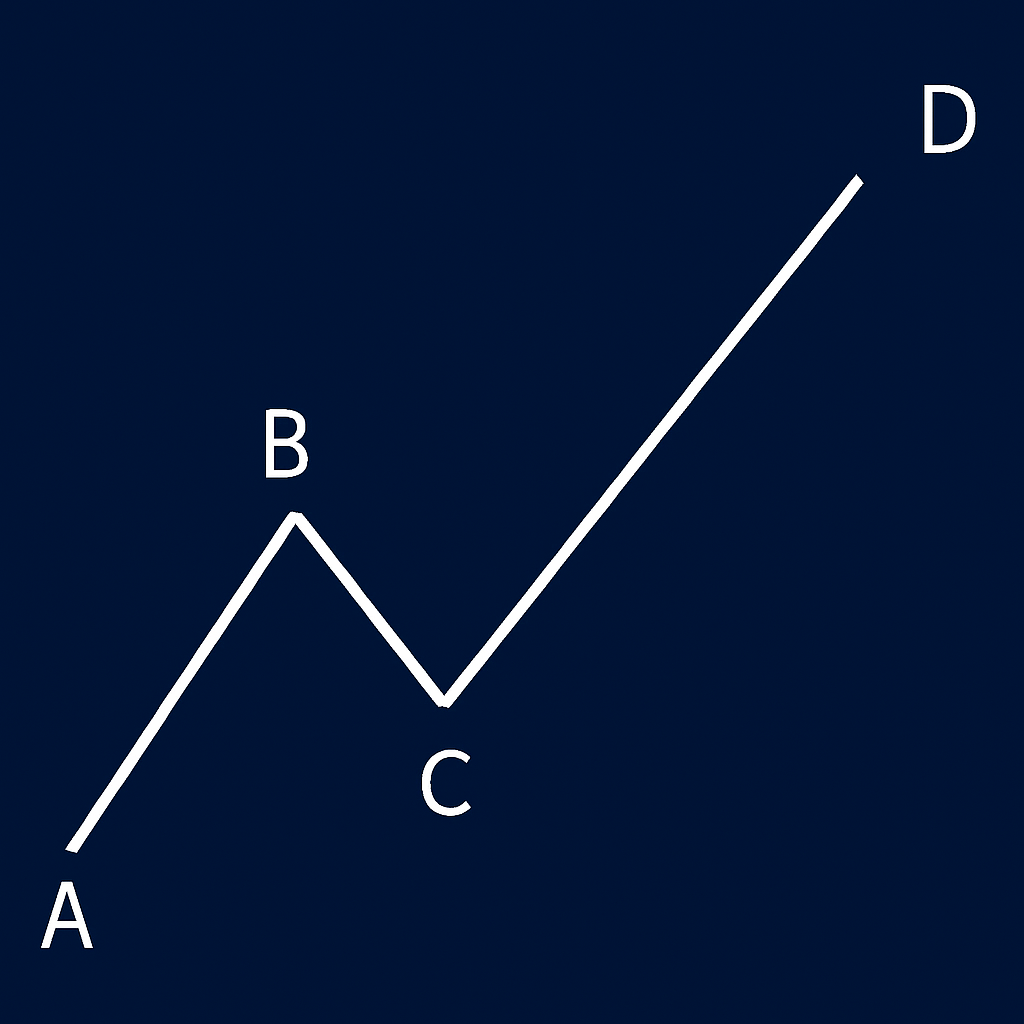
The ABCD pattern is a four-point price structure used in technical trading. It maps out how the market often moves in waves: up, down, then up again (or down, up, then down again for shorts). Each point—A, B, C, and D—marks a key turning area in the price.
It works like this:
Point A starts the move.
Point B is the first turning point.
Point C is the retracement.
Point D is the final move and where many traders enter or exit.
This setup shows up on all timeframes and across most markets. Whether you’re day trading futures or swing trading forex, it gives you a clear structure to plan around.
The AB leg is the first price movement. The BC leg is a pullback—usually around a 0.618 retracement of AB. Then the CD leg mirrors AB, aiming to complete the pattern.
Some traders call it a harmonic pattern, but you don’t need to be a math genius to use it. The real goal is to spot where the market is likely to pause or reverse—and act with a plan instead of a guess.
Done right, ABCD pattern trading helps you avoid chasing price and gives you an edge in your strategy.
Breaking Down the ABCD Pattern
To trade the ABCD pattern, you need to know what each point means and how the market tends to behave at those levels. Let’s break it down step-by-step.
Point A
This is where the move begins. You’ll usually see a sharp shift in price, either up or down. This starts the pattern. Nothing to trade yet—you’re just watching.
AB Leg
This is the first strong move. Traders call this the impulse leg. It should be clean and directional, with strong candles and momentum. Think of it like the engine starting the move. This sets the tone for the rest of the pattern.
Point B
Here, the move hits resistance (if bullish) or support (if bearish). This is where the first wave starts to slow down. You’ll often see hesitation in the price chart, maybe even a small reversal. Some traders take profit here, but others are watching for the pullback.
BC Leg
Now the price pulls back. This is a key part of the setup. Many traders use a 0.618 retracement of the AB leg as a zone to watch. This leg shows how strong or weak the trend is. Too deep of a pullback? The pattern might not be valid. But if the pullback is controlled, you're on track.
Point C
This is the lowest point of the pullback (in a bullish setup) or the highest point (in a bearish one). Think of this as your prep zone. This is where traders start watching closely for signs the pattern is setting up.
CD Leg
Here’s where things get interesting. The CD leg should match the length and energy of the AB leg. When the move starts out of Point C, you’re getting close to execution.
Point D
This is where the pattern completes. Point D is your potential entry or exit, depending on how you plan to trade it. It’s often a spot where price runs out of steam. Many traders use this area to place a sell order (in bullish setups) or buy (in bearish setups), aiming to catch a reversal.
The key to this whole setup is patience. You don’t want to enter random spots. You’re waiting for price to move from A to B, retrace to C, and then land at D. That’s where the best risk-to-reward setups are found.
If you’re using TradingView or another platform, you can mark these points with lines or use a built-in ABCD tool to help visualize the pattern.
How to Trade the ABCD Pattern: Step-by-Step
Spotting the pattern is one thing. Trading is where most traders either make money or take a loss. Here’s how to approach it with a strategy that respects your risk and keeps things simple.
Step 1: Watch the Market for the AB Leg
Look for a strong move in one direction. The candles should be clean, with momentum. No choppiness. This is the AB leg. Let it finish.
Step 2: Wait for the BC Pullback
Now watch for the price to reverse. You’re not trading yet. Use Fibonacci tools if you want, and look for the BC leg to land around the 0.618 retracement of AB. You’re watching to see if Point C is forming.
Step 3: Get Ready as Price Moves Toward Point D
Here’s where you start planning the trade. Use your measuring tools to project how far CD could go—often it mirrors AB. Some traders use simple math. If AB was a 10-point move, they expect CD to also be around 10 points.
Step 4: Enter at or Near Point D
Once the price gets to your expected Point D, you’re ready to enter. You’re looking for a reversal—signs like exhaustion candles, volume dropping, or price stalling. Some traders wait for confirmation from an indicator, others use price action alone.
Step 5: Set Your Stop and Take Profit
Your risk needs to be clear. Most traders place a stop-loss just beyond Point D. If price keeps running, you’re out with a small loss. If it turns, you’re in a good spot. Your profit target is usually somewhere around Point C or halfway back to A.
Step 6: Let the Trade Play Out
Once you're in, the hard part is over. Trust the plan. Don't move your stop unless you have a rule for it. Give the price time. This pattern isn’t about chasing. It’s about structure.
The ABCD trading pattern works because it gives you clear spots to act. You’re not reacting to random movement. You’re trading a plan based on how price behaves again and again.
This is the kind of trading strategy that fits well with BluSky evaluations, where consistency and discipline matter. You don’t need to catch every move. Just trade the ones that make sense.
When to Use the ABCD Pattern
The ABCD pattern works best when the market gives you room to think. If things are moving fast and price is spiking up and down, it’s better to wait.
Look for this pattern in market conditions that are stable but directional. That means trending days with pauses, or range days where you can still spot clean moves. It shows up often in the futures market—especially on the E-mini S&P 500, crude oil, and gold. You’ll also find it in forex and stocks, especially after a strong news move.
If you’re day trading, the pattern tends to show up after the opening move. The market pushes in one direction (AB), then pulls back (BC), then runs again (CD). It can also show up late in the session when price starts to settle and traders are squaring off.
Here’s when you shouldn’t use the ABCD pattern:
During big news events (FOMC, CPI, etc.)
In tight chop with no clear direction
When price is reacting violently to unexpected headlines
Remember, the ABCD trading pattern gives you structure. But structure needs a market that lets you see the legs forming clearly. If things are noisy, step aside. Good setups come when the price movement makes sense.
Common Mistakes Traders Make
The ABCD pattern is simple. But simple doesn’t mean easy. Most traders don’t struggle with spotting the pattern—they struggle with trading it right.
Here are the most common mistakes:
1. Entering Too Early at Point C
Some traders think Point C is the move. It’s not. Point C is the setup—not the entry. The pattern doesn’t finish until price gets to Point D. If you jump in too early, you’ll often get caught in a false move and stop out.
Tip: Be patient. Let the pattern complete. Don’t guess where Point D might be—let the price show you.
2. Ignoring Risk
Just because the pattern is clear doesn’t mean the trade is safe. Without a stop, a clean setup can turn into a fast loss. The best traders use small size, defined risk, and wait for confirmation before going in.
Tip: Always place your stop just beyond Point D, and make sure your target gives you at least a 2:1 reward-to-risk ratio.
3. Forcing It in the Wrong Market Condition
Not every chart needs to be traded. Forcing the ABCD pattern when the market is choppy, reacting to news, or moving sideways with no structure will lead to losses and frustration.
Tip: If the legs aren’t clean and the price isn’t moving with intent, leave it. Time not trading is better than bad trades.
4. Not Reviewing Past Trades
This one hurts traders long-term. If you trade the ABCD pattern but never go back to look at your winners and losers, you’ll keep making the same mistakes.
Tip: Use a journal. Track each ABCD trade. Write down the time, entry, stop, and what the market looked like. That’s how you get better.
ABCD Pattern Across Different Markets
The ABCD pattern shows up everywhere—if you know how to look.
You’ll see it in futures markets like the E-mini S&P 500, crude oil, and gold. These are fast-moving contracts with clean chart structure, which makes them perfect for spotting patterns. Futures also trade nearly 24 hours, so you’ll get multiple chances to find solid setups throughout the day.
In forex, the pattern is just as useful. Currency pairs like EUR/USD or GBP/JPY often move in measured legs, especially after news. Many forex traders rely on the ABCD structure to catch breakouts or reversals without chasing price.
The pattern also works well in stocks, especially small caps that have big moves during the first hour of the session. If you’re trading stocks or CFDs, the ABCD gives you a way to measure risk and plan entries in advance.
Even cryptocurrencies—which are known for being wild—can show clear ABCD moves. The pattern gives you structure in a market that often feels unpredictable.
Bottom line: if it has a chart, it can print an ABCD pattern. Just make sure the market conditions are right and the legs are clear. The pattern isn’t locked to one style of trading—it’s a tool any serious trader can add to their strategy.
The ABCD pattern isn’t magic. It’s not going to win every trade or guarantee profit. But it gives you a plan—and that’s more than most traders have when they click buy or sell.
At BluSky, we see traders succeed when they follow structure. The ABCD trading pattern is one of the cleanest ways to build that structure into your trading plan. Whether you’re in an evaluation or a funded account, this setup fits our rules and supports smart decisions.
So next time you’re staring at a chart, ask yourself—
Where’s A? Where’s B? Where’s C?
If you can answer that, you might be close to your next trade.